We show how Gaussian distribution (a.k.a. normal distribution) is constructed and list some of its basic properties.
Suppose we would like to have a distribution in R, such that
It is centered at the origin.
Its density function decreases exponentially with respect to the square distance to the origin.
Remark: if we replace 2 with "a density function decreases exponentially with the distance to the origin", we obtain Laplace distribution.
The density function p(x) should be inversely and exponentially proportional to x2:
p(x)∝exp(−x2)
Denote M the value of
M≐∫−∞∞exp(−x2)dx.
It is easy to check that M is finite.
Then the close form of p(x) is
p(x)=M1exp(−x2).
It is easy to verity that p(x) is a valid density function: ∫−∞∞p(x)dx=1.
Closed Form
Theorem.
$
p(x) = \frac{1}{ \sqrt \pi} \exp( - x^2 )
$
is a density function.
In general, it is not hard to construct a distribution. Let h(x) be any integrable function on a domain D such that
M=∫Dh(x)dx<∞
Then we can view h(x) as almost an density function of some distribution.
The only obstacle is that M might not be 1.
However this is easy to fix.
We scale the value of h(x) by a constant factor at each point by setting
p(x)=M1h(x).
In this case, we don't even need to know the exact value of M.
We only need to guarantee that
The value of M exists and is finite.
Then we can safely rely on M as a normalized. For example, we know that
∫0∞x0.2e−xdx≤∫01e−xdx+∫1∞xe−xdx<∞.
We can construct a density function as discussed above.
It turns out that this is a special case of Gamma distribution.
For Gaussian distribution, we are lucky as the closed form of M does exists, due to the following "squaring trick":
Denote r≐x2+y2 the distance of (x,y) to (0,0).
We are integrating the function exp(−r2) over the plane R2.
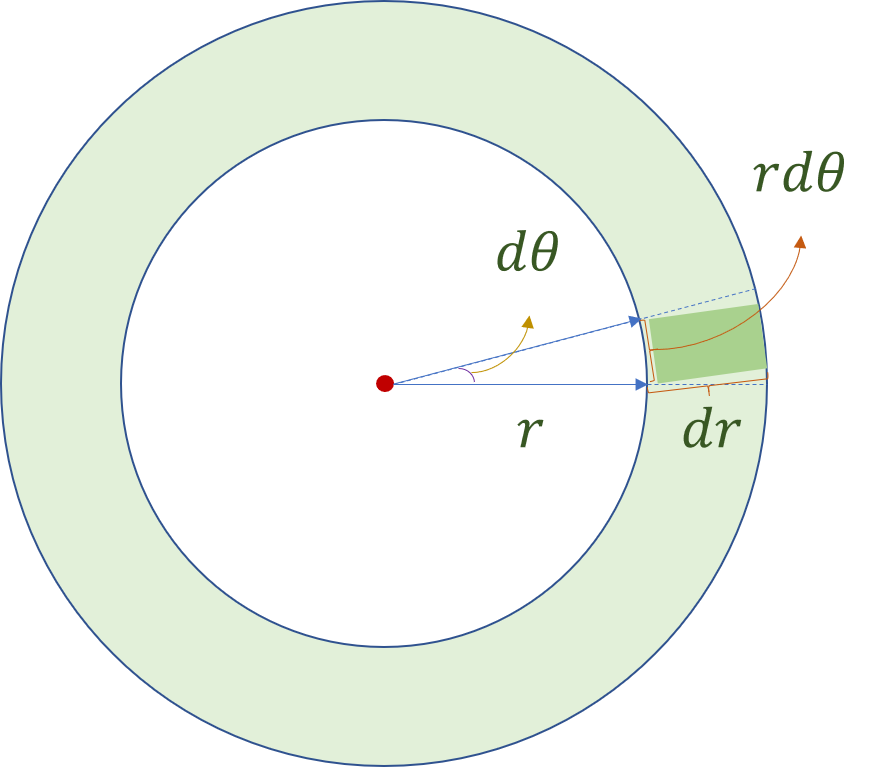
It is natural to switch to polar coordinate system (r,θ), where θ is the angle of a point.
Here is an informal but intuitive explanation.
As the picture below demonstrates, if r increases by dr and θ increases by dθ, the new area spanned by dr and dθ is roughly rdrdθ.
We can also calculate this algebraically
We have proved that if X is a random variable with density function p(x)=π1exp(−x2), then
Var[X]=21.
Define another random variable Y≐2X, whose variance is
Var[X]=2Var[X]=1.
To obtain its density function of Y, we first scale the function p(x) horizontally by a factor of 2 to get
π1exp(−2x2).
Now the area under the curve f(x)=π1exp(−x2/2) is 2.
We normalize this area to 1 and obtain Y's density function as
p(y)=2π1exp(−2y2)
In what follows, we use N(0,1) to denote a Gaussian distribution with mean 0 and variance 1.
We can also scale X by a factor of 2σ for any σ>0, to get Y=2σX.
It have variance σ2 and density function
p(y)=2πσ21exp(−(2σy)2)=2πσ21exp(−2σ2y2).
Finally, we can shift the center of 0 by any real number μ∈R to obtain a new density function
p(y)=π⋅2σ21exp(−2σ2(y−μ)2).
The corresponding distribution is denoted as N(μ,σ2).
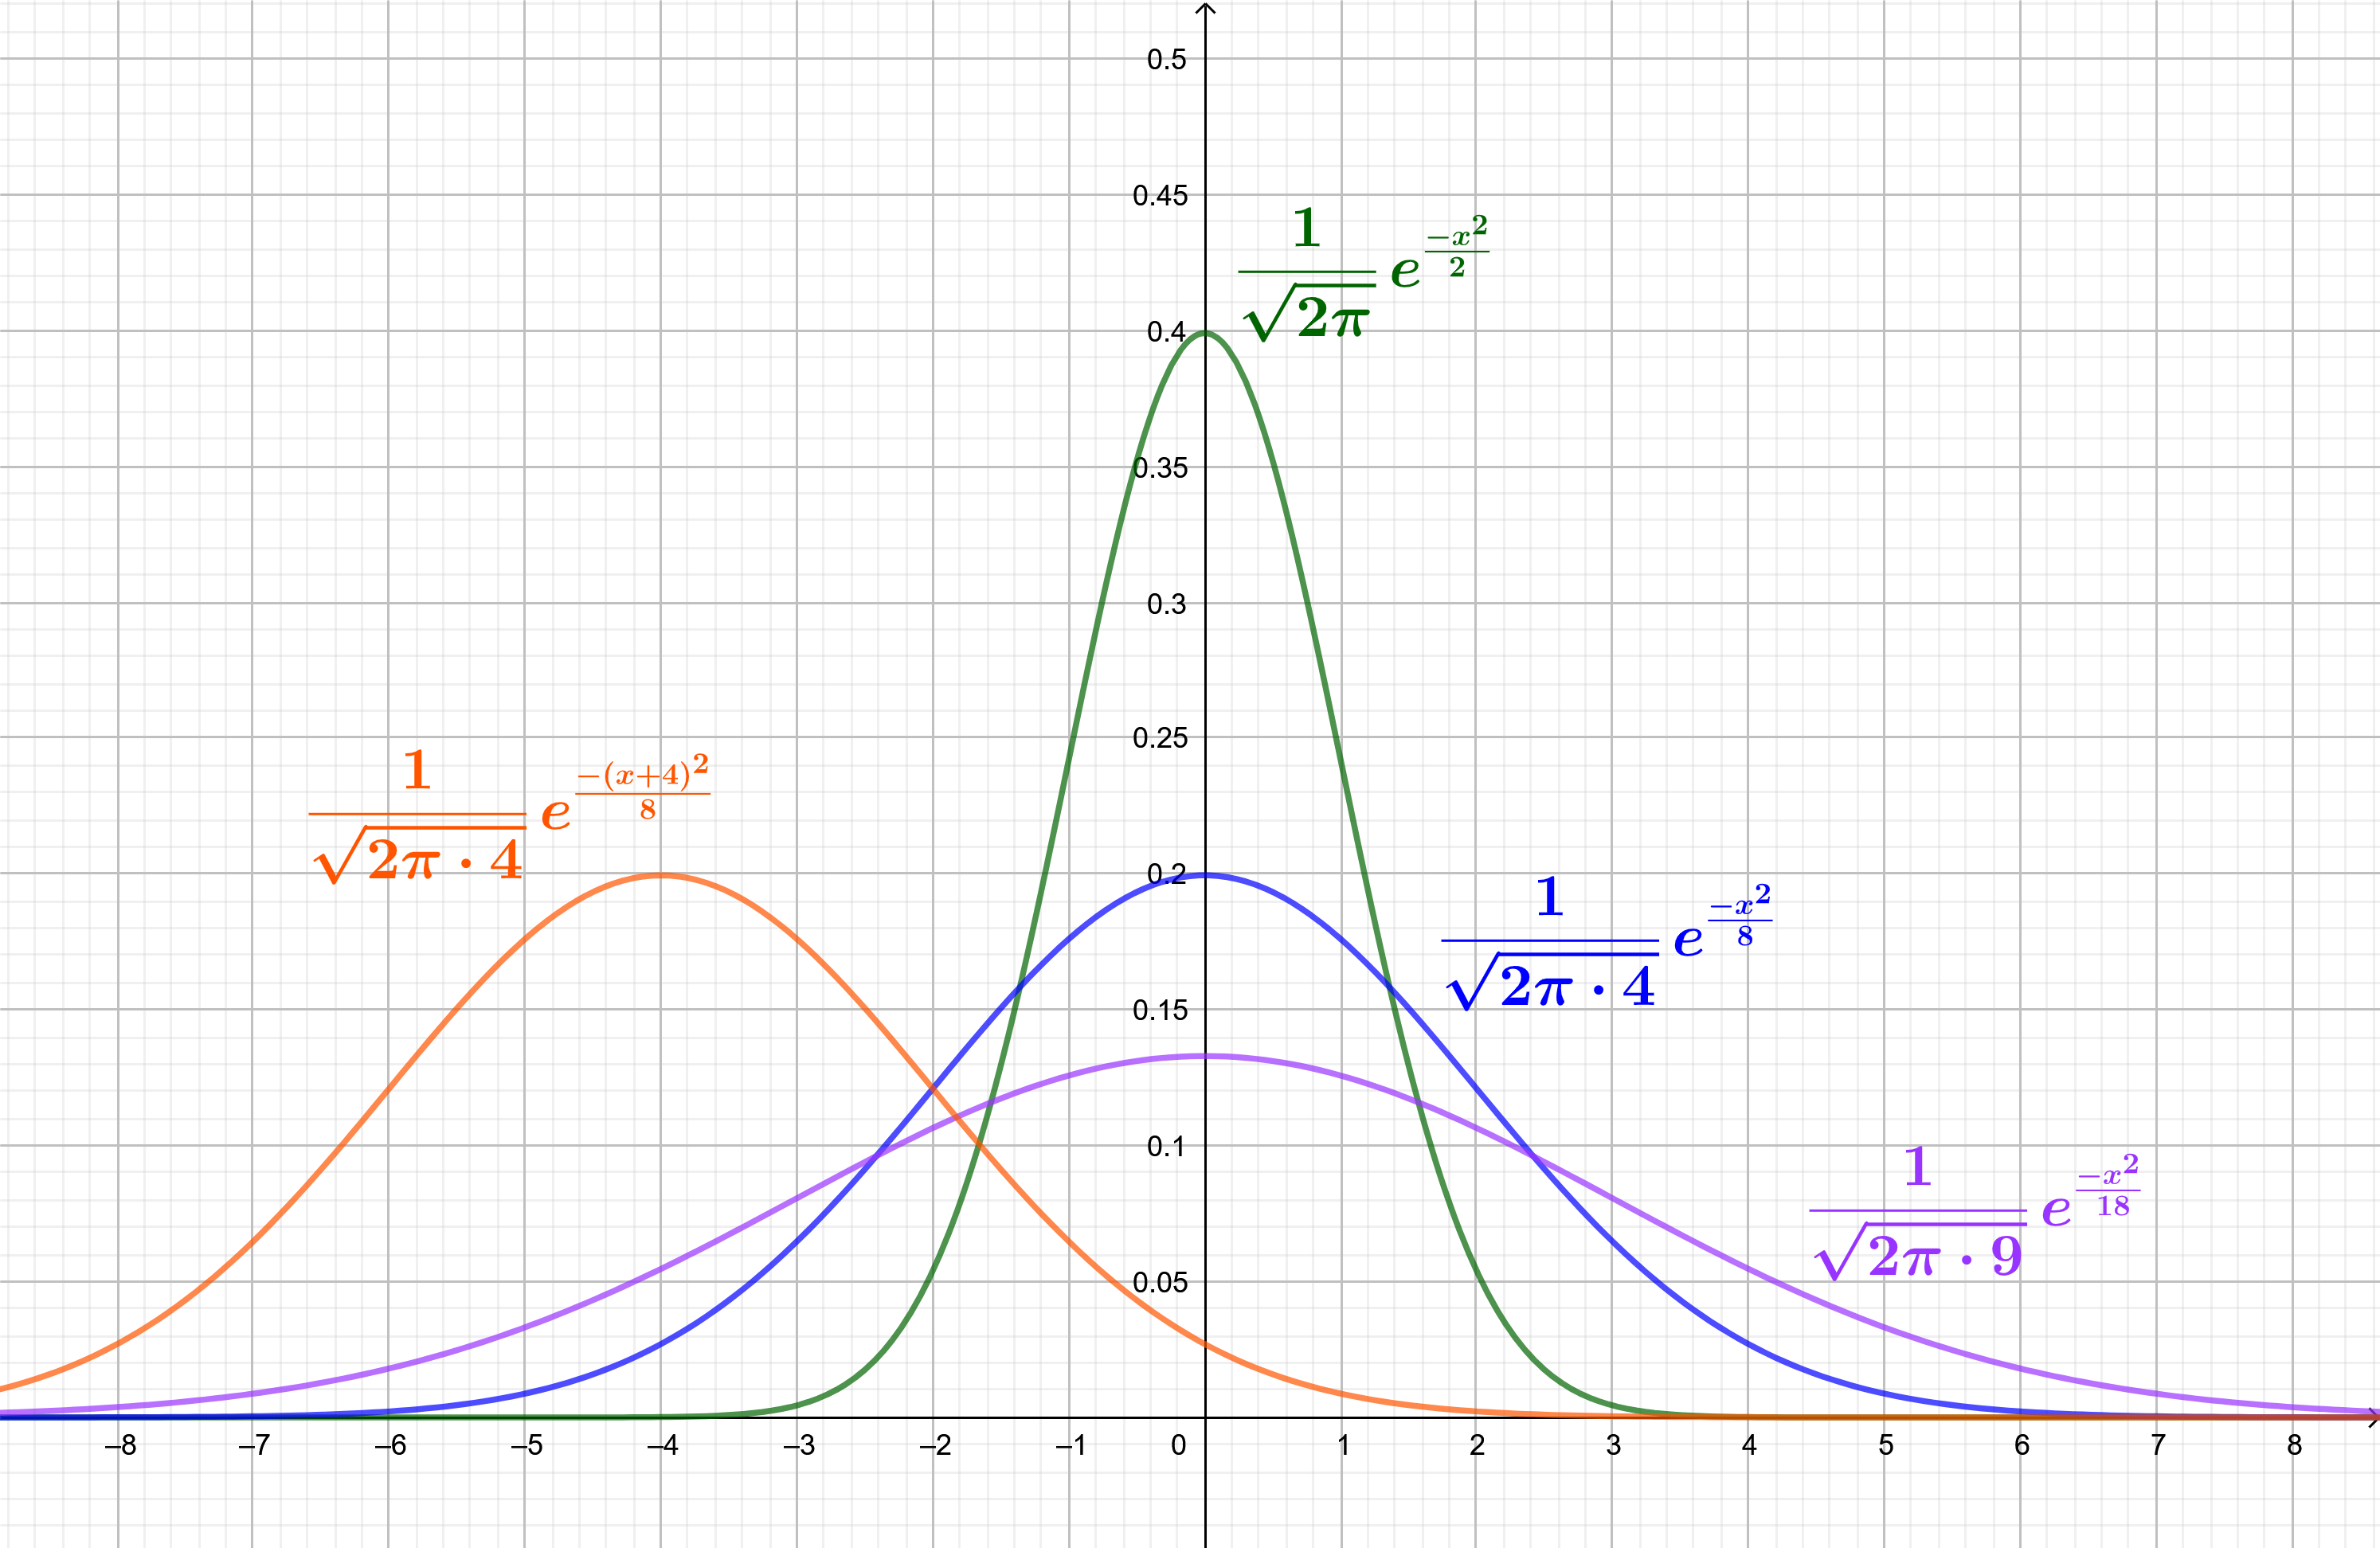
The picture below shows a few Gaussian distributions.
Advanced Properties
Sum of Normal Random Variables
If X∼N(μ1,σ12) and Y∼N(μ2,σ22), then for each a,b∈R,
aX+bY∼N(aμ1+bμ2,a2σ12+b2σ22).
Let X′,Y′∼N(0,1).
Then X=μ1+σ1X′ and Y=μ2+σ2Y′,
and
Hence, we can assume without lose of generality that X,Y∼N(0,1), and prove that aX+bY∼N(0,a2+b2) for each a,b∈R.
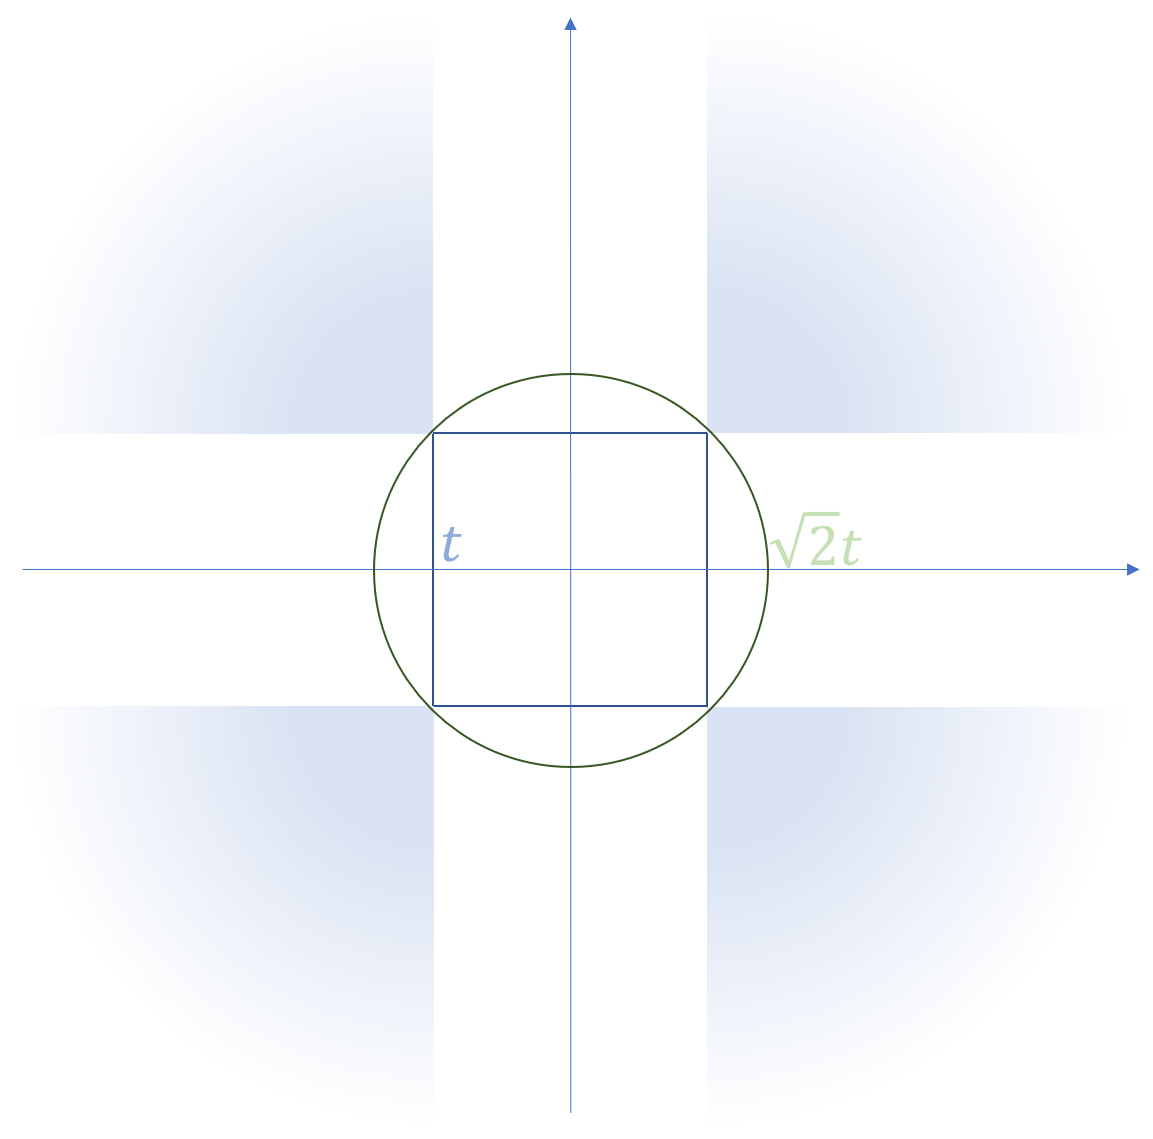
The demonstration here follows from [1]. The key observation is that if X,Y∼N(0,1), the joint distribution of X and Y is rotation invariant with the origin.
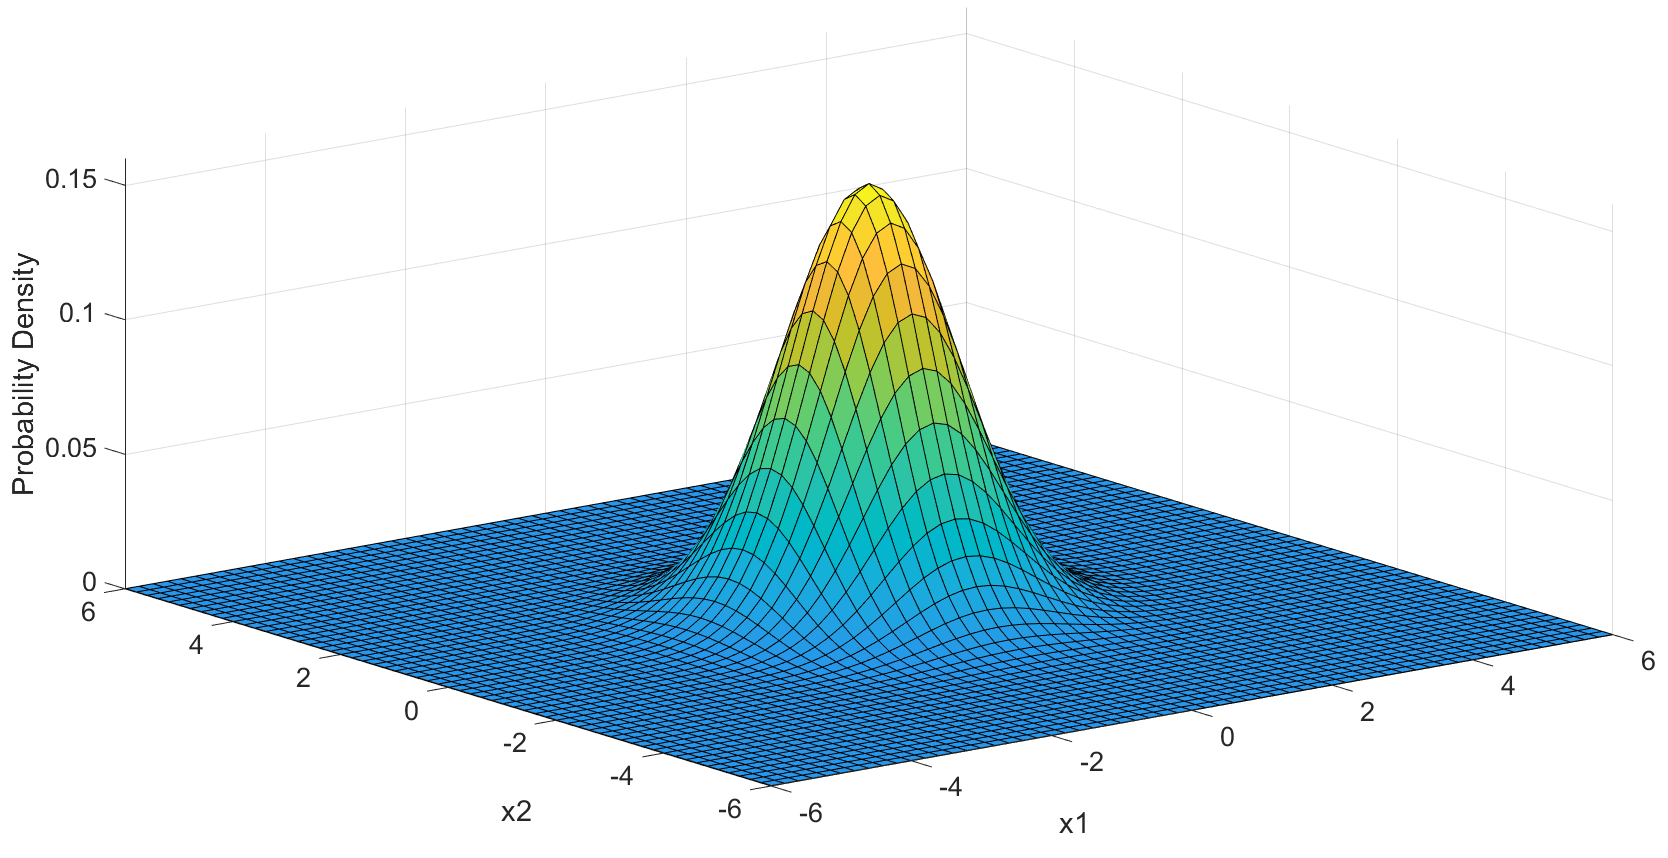
The figure below shows the same distribution. Observe again that the probability mass concentrates at a small region centered at origin.
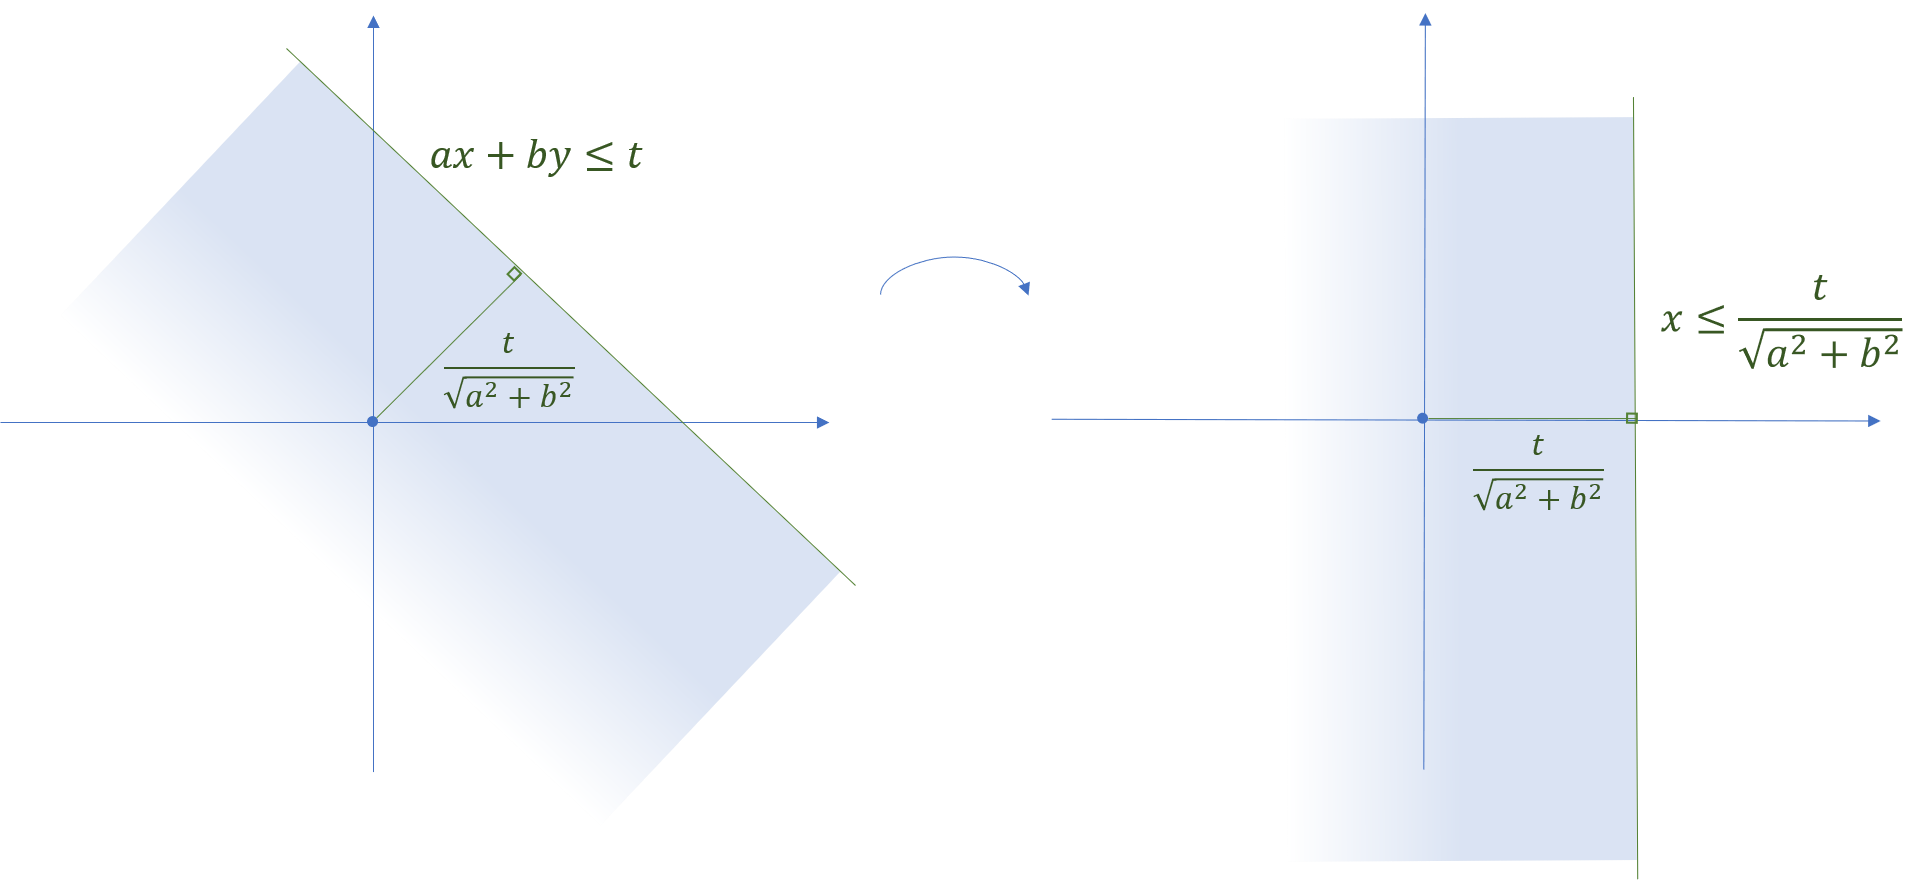
Therefore, for any t∈R, the set
{(x,y)∈R2:ax+by≤t}
has the same probability measure as the one
{(x,y)∈R2:x≤a2+b2t}.
Observe that the latter can be obtained by rotating the former with respect to the origin (see the figure below).
Now, the probability of the latter set is given by
Pr[X≤a2+b2t]=Pr[a2+b2X≤t]
It concludes that X+Y has the same distribution as a2+b2X∼N(0,a2+b2).
Concentration Inequalities
Bound 1
If X∼N(0,σ2), then ∀t>0,
Pr[∣X∣≥t]≤exp(−2σ2t2)
Remark: it is possible to get a tighter bound by using more advanced techniques.
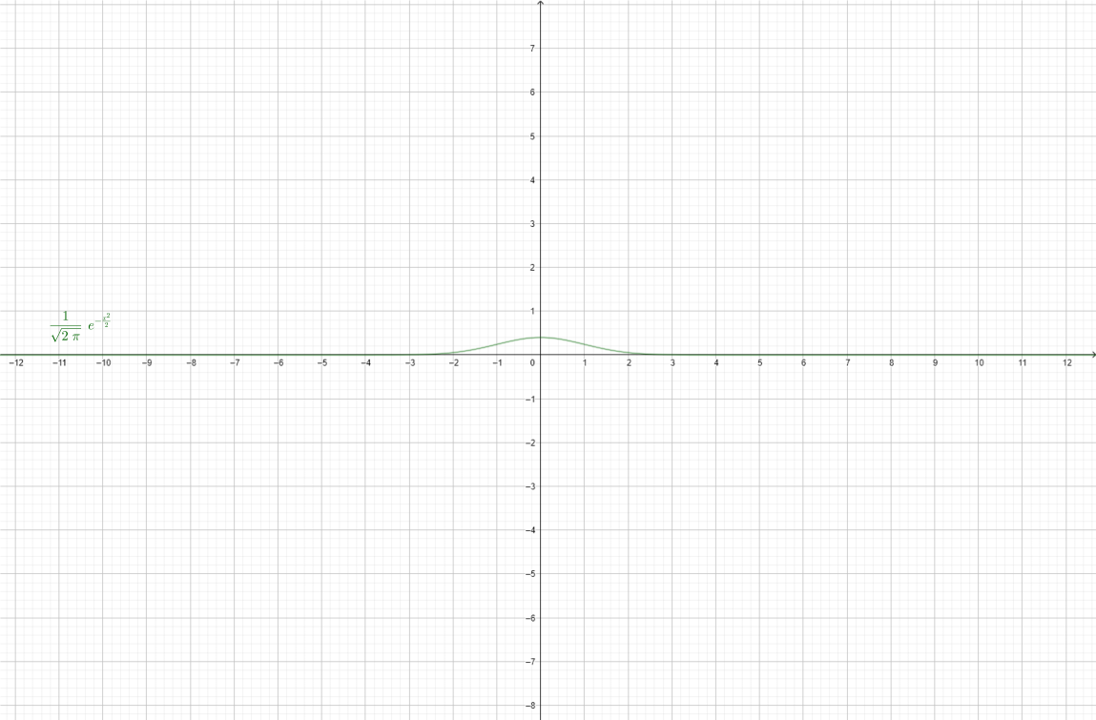
Intuition: in previous figures, it seems Gaussian distributions have a shape bump around its mean.
This is kind of mis-leading, because the x-axis and y-axis are scaled.
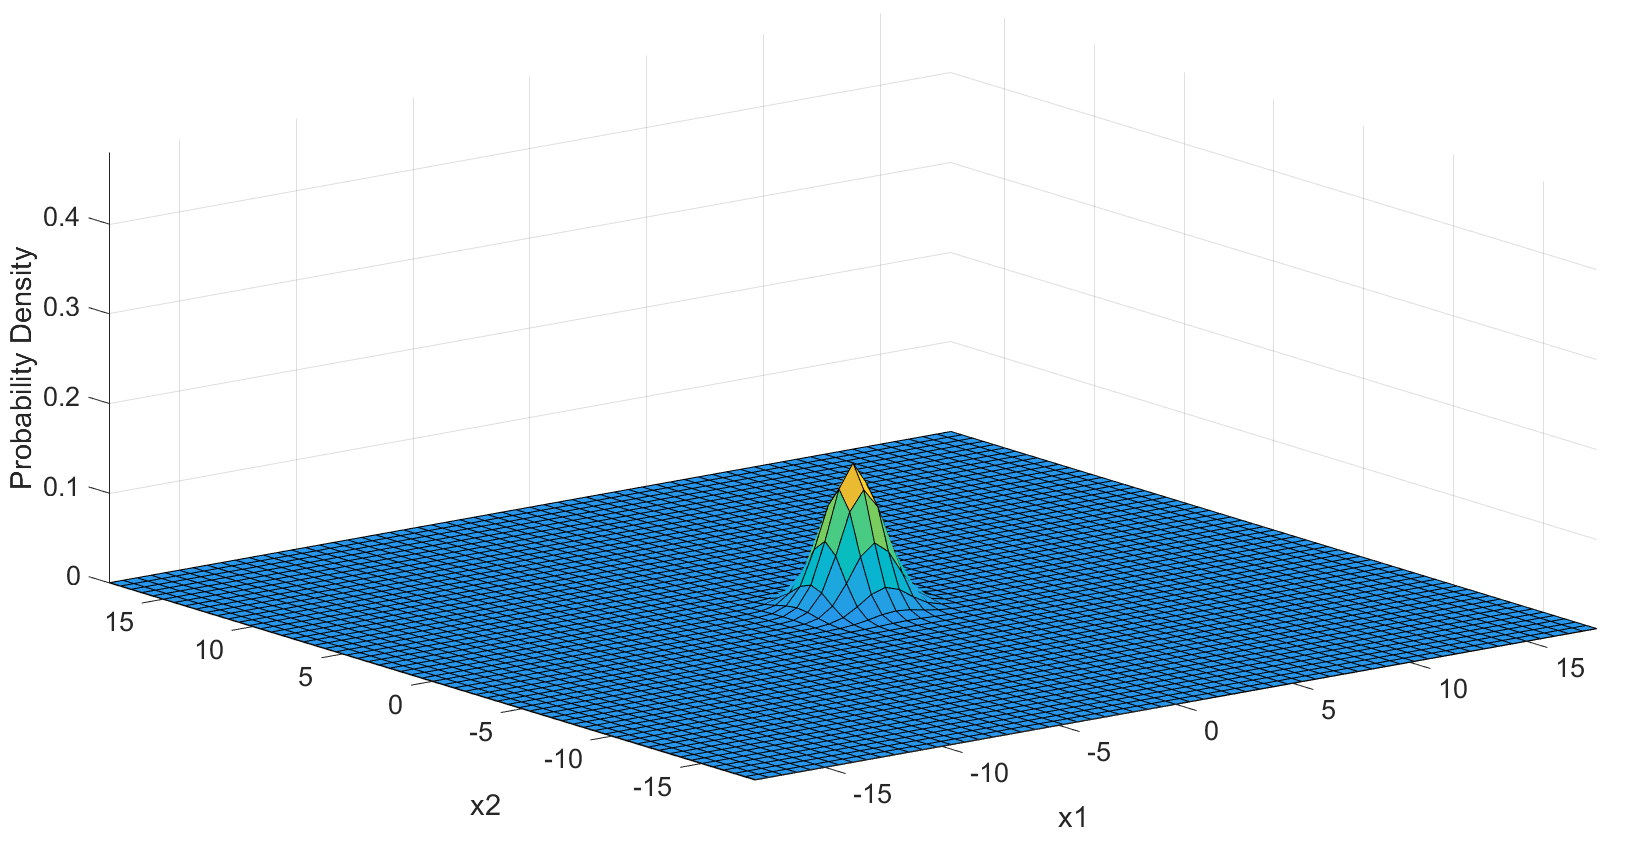
In the figure below, we plot N(0,1), with ratio between x and y axes being approximate 1:1.
We see only a small bump around its mean.
Although the distribution span the entire range of R, the probability mass is centered tightly around the origin.
Proof by Moment Generating Function
We prove a weaker version by a factor of 2. For all λ∈R,
This bound is more useful only when we know that t≥2πσ.
Reference
[1] B. Eisenberg and R. Sullivan, “Why Is the Sum of Independent Normal Random Variables Normal?,” Mathematics Magazine, vol. 81, no. 5, pp. 362–366, Dec. 2008