Suppose we have complex mapping f : X → Y f : X \rightarrow Y f : X → Y X , Y ⊂ C X, Y \subset \mathbb{C} X , Y ⊂ C
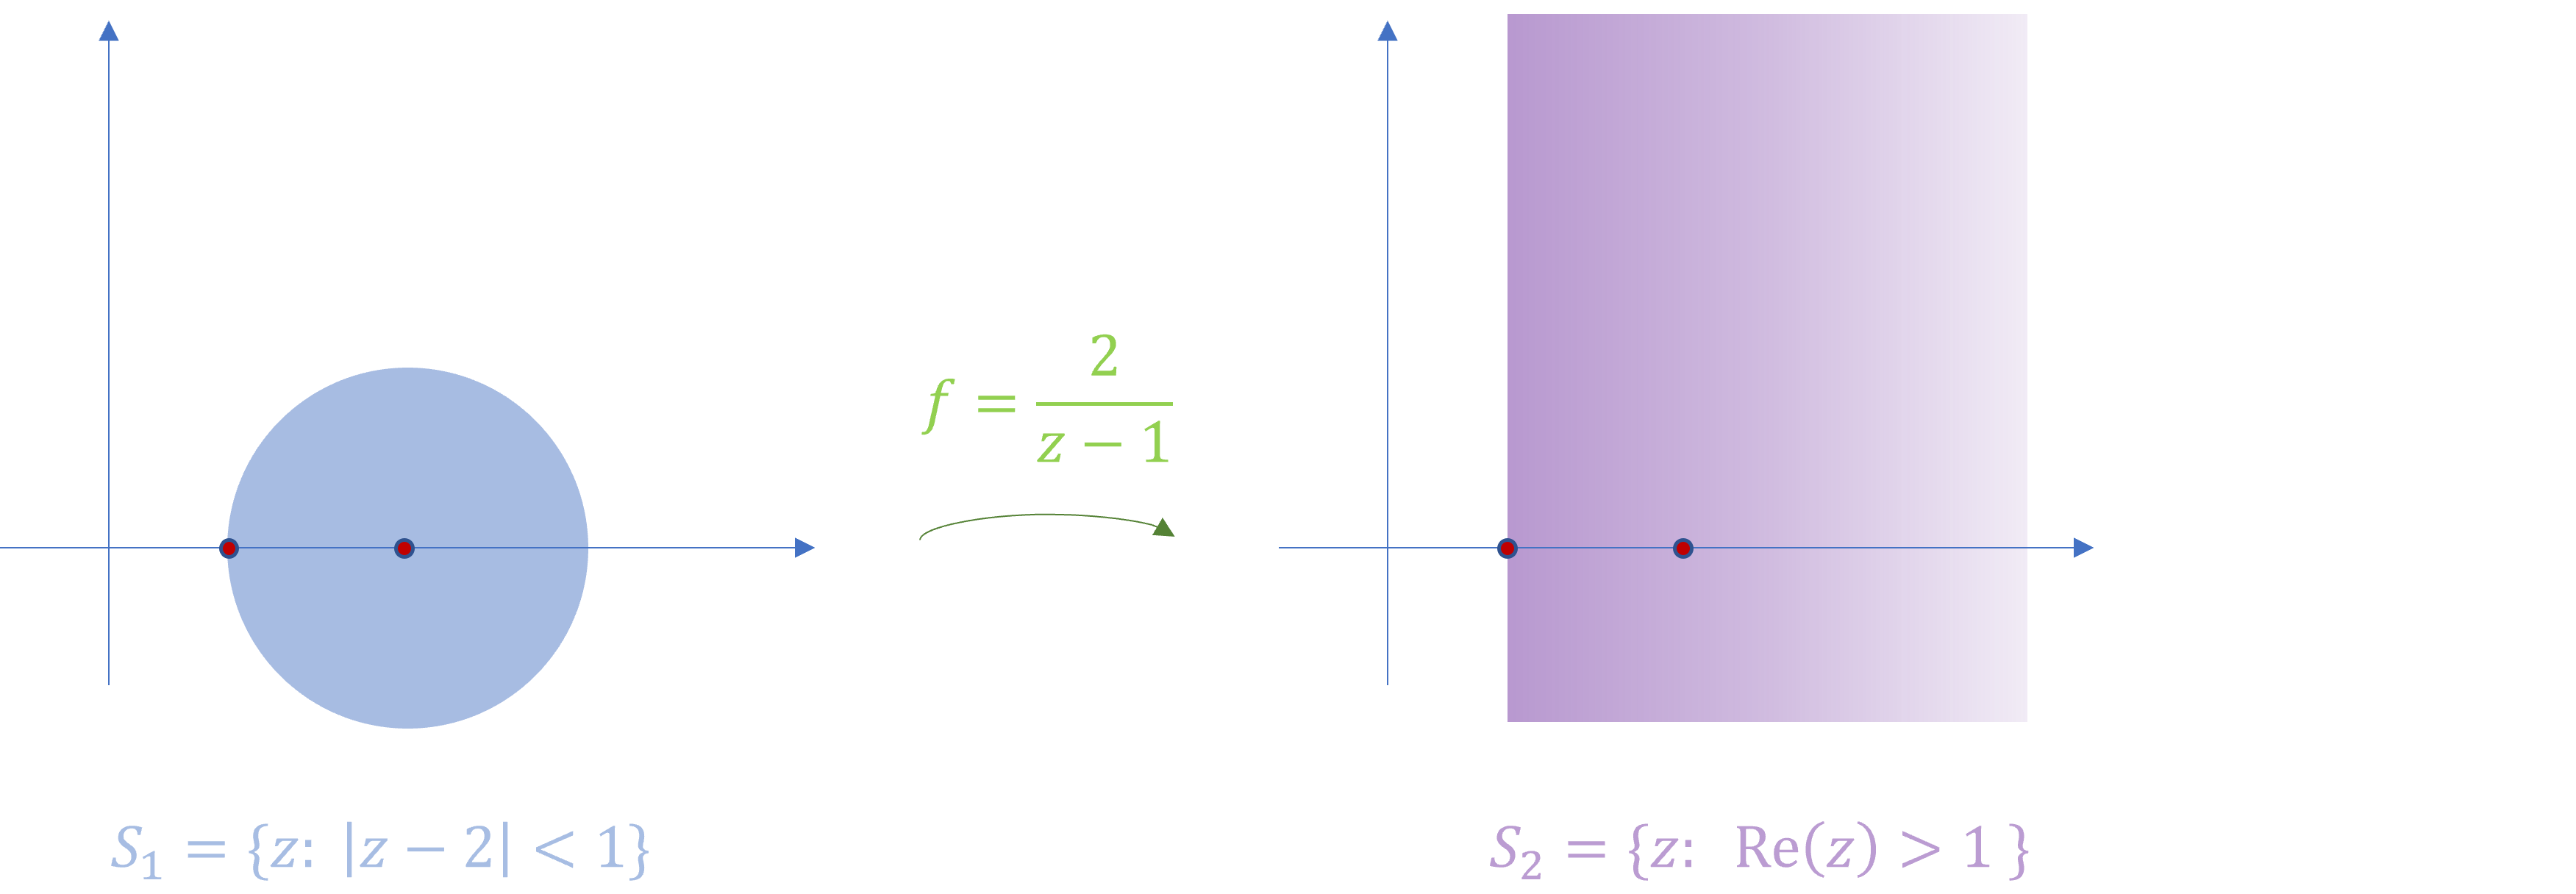
For example, consider the unit cycle centered at 2 2 2
S 1 ≐ { z ∈ C : ∣ z − 2 ∣ < 1 } .
S_1 \doteq \{ z \in \mathbb{C} : | z - 2 | < 1 \}.
S 1 ≐ { z ∈ C : ∣ z − 2∣ < 1 } . Let f ( z ) ≐ 2 z − 1 f(z) \doteq \frac{2}{z - 1} f ( z ) ≐ z − 1 2 S 1 S_1 S 1
S 2 ≐ { z ∈ C : Re ( z ) > 1 } .
S_2 \doteq \{ z \in \mathbb{C} : \text{Re}(z) > 1 \}.
S 2 ≐ { z ∈ C : Re ( z ) > 1 } . This is shown by the picture below.
We verify this algebraically.
Proof 1. Let w = 2 z − 1 w = \frac{2}{z - 1} w = z − 1 2 w ≠ 0 w \neq 0 w = 0
z − 1 = 2 w ⟹ z = 2 w + 1.
{\small
z - 1 = \frac{2}{w} \implies z = \frac{2}{w} + 1.
}
z − 1 = w 2 ⟹ z = w 2 + 1. Hence,
∣ z − 2 ∣ < 1 ⟹ ∣ 2 w − 1 ∣ < 1 ⟹ ∣ 2 − w w ∣ 2 < 1 ⟹ ∣ 2 − w ∣ 2 < ∣ w ∣ 2 ⟹ ∥ ( 2 − x , y ) ∥ 2 2 < ∥ ( x , y ) ∥ 2 2 let w = ( x , y ) ⟹ 4 − 4 x < 0 ⟹ 1 < x .
\begin{aligned} \small
|z - 2 | < 1
&\implies \left| \frac{2}{w} - 1 \right| < 1 \\
&\implies \left| \frac{2 - w}{w} \right|^2 < 1 \\
&\implies \left| 2 - w \right|^2 < |w|^2 \\
&\implies \Vert (2 - x, y) \Vert_2^2 < \Vert (x, y) \Vert_2^2 &\text{let } w = (x, y) \\
&\implies 4 - 4 x < 0 \\
&\implies 1 < x.
\end{aligned}
∣ z − 2∣ < 1 ⟹ w 2 − 1 < 1 ⟹ w 2 − w 2 < 1 ⟹ ∣ 2 − w ∣ 2 < ∣ w ∣ 2 ⟹ ∥ ( 2 − x , y ) ∥ 2 2 < ∥ ( x , y ) ∥ 2 2 ⟹ 4 − 4 x < 0 ⟹ 1 < x . let w = ( x , y ) □ \square □
Proof 2. Denote the border of S 1 S_1 S 1 z = 2 + e i θ z = 2 + e^{i \theta} z = 2 + e i θ θ ∈ [ − π , π ) \theta \in [-\pi, \pi) θ ∈ [ − π , π )
w = 2 z − 1 = 2 1 + e i θ = 2 1 + e i θ ⋅ e − i θ / 2 e − i θ / 2 = 2 e − i θ / 2 e − i θ / 2 + e i θ / 2 = 2 ⋅ cos ( θ / 2 ) + i sin ( θ / 2 ) 2 cos ( θ / 2 ) = 1 + i tan ( θ / 2 ) .
\begin{aligned}
w
&= \frac{2}{z - 1} \\
&= \frac{2}{1 + e^{i \theta } } \\
&= \frac{2}{1 + e^{i \theta } } \cdot \frac{e^{- i\theta / 2 } }{ e^{ - i \theta / 2 } } \\
&= \frac{2 e^{ - i \theta / 2} }{ e^{ - i \theta / 2 } + e^{i \theta / 2} } \\
&= 2 \cdot \frac{ \cos (\theta / 2) + i \sin (\theta / 2) }{ 2 \cos (\theta / 2) } \\
&= 1 + i \tan (\theta / 2).
\end{aligned}
w = z − 1 2 = 1 + e i θ 2 = 1 + e i θ 2 ⋅ e − i θ /2 e − i θ /2 = e − i θ /2 + e i θ /2 2 e − i θ /2 = 2 ⋅ 2 cos ( θ /2 ) cos ( θ /2 ) + i sin ( θ /2 ) = 1 + i tan ( θ /2 ) . □ \square □
← Back to all notes Back to top ↑